Team Health Report
Overview:
The Team Health Report looks at the team level of an organization. It combines the scores of each individual from the selected filter (department, location, organization, etc.) and displays the overall results of that group. It can be used to examine trends across the team to determine where a team may need development or support.
How to read the Team Health Report:
The Team Health report is 2-pages and covers four main areas:
- Current Operating Level
- Attachment Level
- Performance Profile
- Stress Source Profile
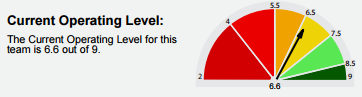
Current Operating Level
The Current Operating Level measures the employees’ satisfaction with the workplace. The higher the score, the greater the probability of workgroup performance, as the team has fewer “blockages” preventing them from accomplishing their objectives.
The Current Operating Level ranges from 2 to 9, where 9 is the best score possible. Ideally, a team will be in the 7.5 to 9 range. The colors on the chart signify how the group is doing, where green is good, yellow is average (or keep an eye on this team) and orange through red are below average or poor scores.
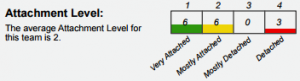
Attachment Level
The Attachment Level is an average of the employees’ Attachment Index. This score shows how attached the employees are to the organization and how likely they are to leave. A score of 1 is very attached, 2 is mostly attached, 3 is mostly detached, and 4 is detached.
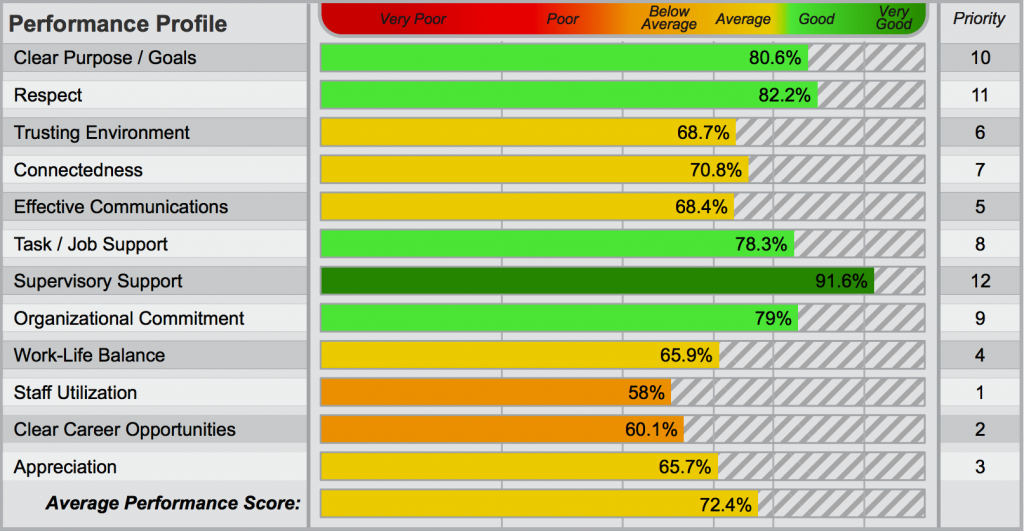
Performance Profile
The Performance Profile shows the average of each of the 12 core profile dimensions required for a healthy, productive workgroup. Based on the team’s result, the system will automatically assign a priority to each dimension them to help you decide how to work with the team first. Generally, Green or Dark Green results are considered acceptable, while Orange and Red results are in need of development. Yellow results are around average, and have less pressing development needs. However, Yellow should be monitored to make sure it doesn’t decline to orange or red. The definitions of these dimensions can be found in the AMP Glossary of Terms. The Average Performance Score is the overall average on how this group is performing in the core profile dimensions.
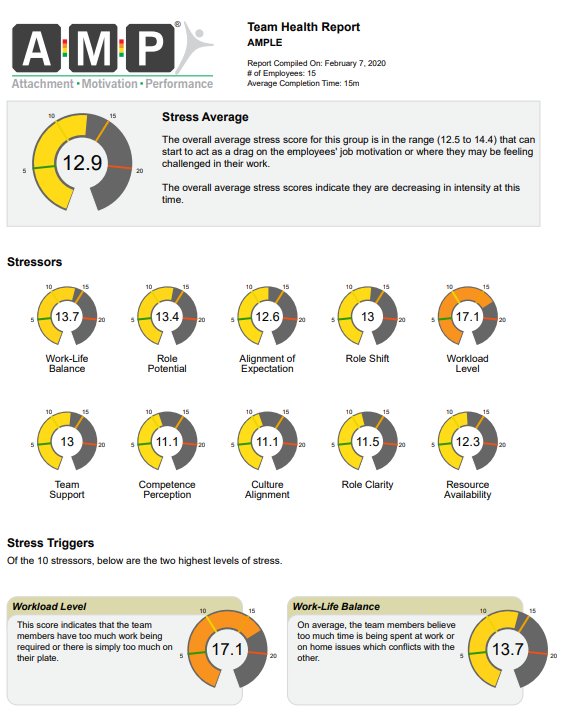
Stress Source Profile (SSP)
The second page of the Team Health report shows the Stress Source Profile, or SSP. The scores are shown with the color changing based on intensity.The first section shows the average overall stress of the group ranging from 5 to 25 points. Next, each of the individual stressors are shown with each of their respective scores. The bottom of the page has the stress triggers. Out of the 10 stressors, this area shows the two areas with the highest levels of stress, along with a brief description of each. These stressors are likely to be leading causes, or impact the other stressors on the list.
For definitions of the SSP dimensions please refer to the AMP Glossary.
How to use the Team Health Report
The Team Health Report is designed to show you the “health” of your organization or team at a glance, and it helps you determine where you should focus your energy. We recommend using this report for team builds or to give a manager/supervisor a snapshot of what’s happening with their team.
The Performance Profile will show which area to focus on first using the priority on the right. The Stress Source Profile also gives the top 2 stressors that are affecting the team. We suggest holding a discussion with the selected team focusing on these areas.
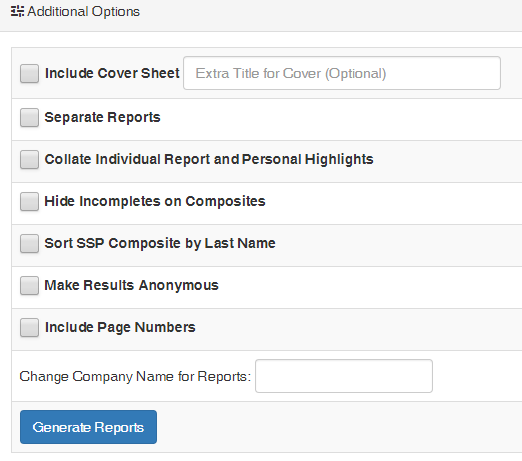
How to generate a Team Health Report
The steps to generate the Team Health Report are the same as the other reports in AMP.
To generate:
1) Go to the Generate Reports page.
2) Filter the data as you desire using the filters at the top of the page.
3 ) Select all individuals or choose specific individuals to run the report on by clicking the check boxes next to their names.
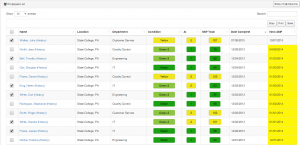
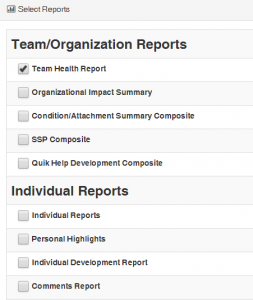
4) Select the desired report – in this case click the button next to “Team Health Report.”
5) Click the “Generate Reports” button. Your report will appear at the top of the page for you to view and download.