SSP Composite Report
Overview
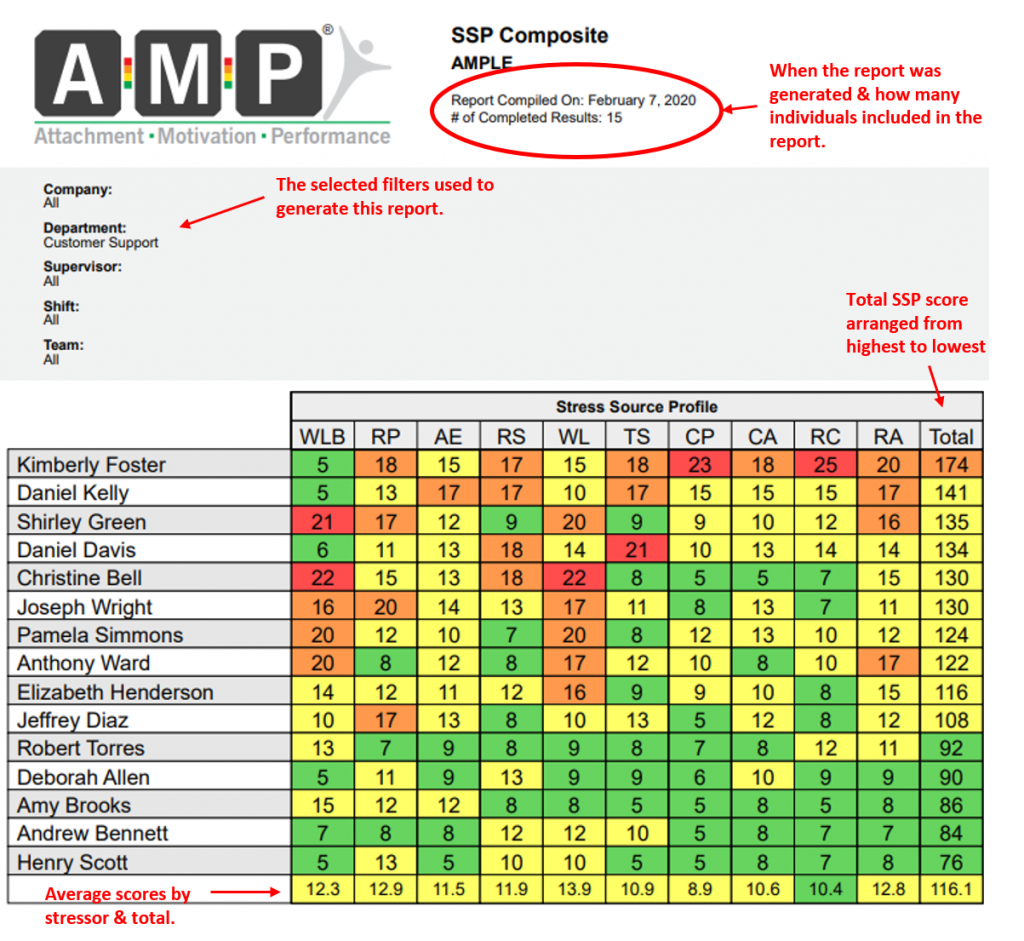
The SSP Composite Report displays the AMP Stress (SSP) results for each selected participant. This composite report helps to give a quick snapshot of who is under the most stress, what stress areas standout from others, and where to focus resources to reduce stress.
How to Read this Report:
By default the SSP Composite us arranged by stress score, from highest to lowest. The top axis features the same stress measures as seen on the Individual SSP reports and the Team SSP Reports. The stressors are colored coded to show the severity of the stress – with Red being highest (worst) and Green lowest (best).
How to use this report:
Interpreting the stress composite is similar to interpreting the SSP results for an individual or team. The results can give a cursory overview of an individual’s situation or go as far as to tell an in-depth story about what troubles someone may be having. However, the SSP Composite is different from the other SSP reports in that it allows you to can easily see detailed results for multiple people all at the same time – helping you create the background picture for what is occurring in a team or department.
To analyze the report, it is recommended to start with the highest stress individuals, focusing on those with stress over 144. Next, look for individuals that have individual stress dimensions that are outliers or particularly extreme, to see if there are any trends to be found.
For instance, an individual with SSP scores in the 5 -10 range, except with a Work Life balance score of 19 shows that this individual is feeling significant stress from home or life outside work, and that their stress is less related to work. This can help to understand where to focus a conversation with this individual.
Generally, the more red and orange dimensions on the composite, the more the results should be carefully monitored. If a significant number of individuals have stress over 144 (severe stress), or the group average is 14 or higher, then actions should be immediately taken to relieve the stress on this team. While temporary stress greater than 144 is okay (i.e. if there is a temporary large project being completed), prolonged severe stress scores increase the risk of attrition, and lower the productivity and physical health of a group.
Remember, high stress is known to spread (via both physical and psychological channels) between individuals. It is important to reduce the stress of your team prior to it getting worse. Think of it as putting out a fire before it has a chance to spread.
How to Generate a SSP Composite Report:
The steps to generate the SSP Composite Report is the same as the other reports in AMP.
To generate:
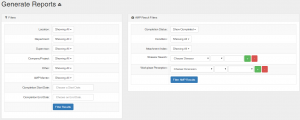
- Go to the generate reports page.

- Filter the data as you desire using the filters at the top of the page.
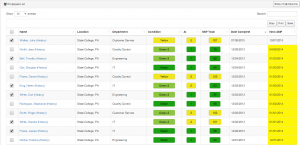
- Select all individuals or choose specific individuals to run the report on by clicking the check boxes.
- Select the desired reports – in this case click the button next to “SSP Composite.”
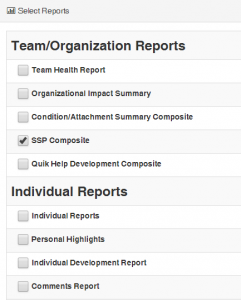
- Click the “Generate Reports” button.

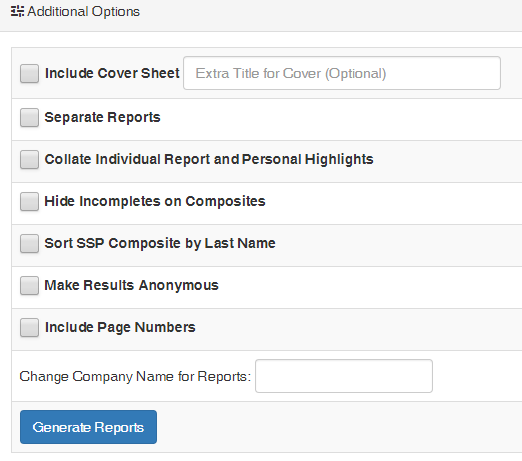
Your report will appear at the top of the page for you to view and download.