Organizational Impact Summary
Overview
The Organizational Impact Report looks at organizational oriented dimensions for a team or entire organization. It combines the scores of each individual from the selected filters (department, location, function, etc.) and displays the overall results of that group. It can be used to examine trends across the organization or team and to determine what organizational trends may be occurring.
How to read the Organizational Impact Summary:
The Organizational Impact Summary is a 3-page report that covers 11 areas:
- Recent Morale Scale
- Recent Morale Changes
- Workgroup Forecast
- Teamness Rating
- Supervisory Support
- Workgroup Health
- Stress Average
- Career Succession
- Organizational Outlook:
- Satisfaction with Company Direction
- Satisfaction with Company Leadership
- Satisfaction with Company Progress
- Quik Help Summary
Each area consists of a graph that represents how the AMP respondents feel about those particular dimensions.
Sections of the Organizational Impact Summary
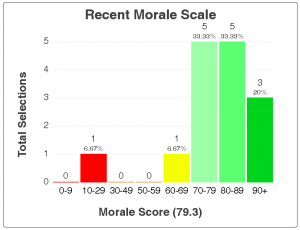
Recent Morale Scale:
This chart shows the selected group’s most recent morale or state of mind. The morale score shows the overall average of the group’s responses. The options range from 0 (lowest or worse) to 90+ (highest). The generally accepted “healthy” zone is 70 or above. Below 60 is of significant concern.
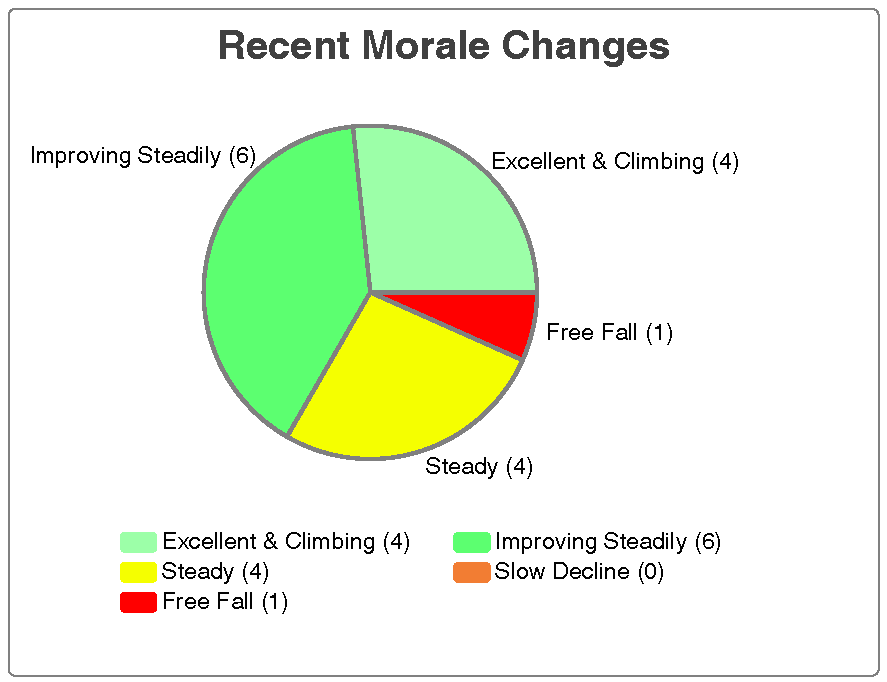
Recent Morale Changes:
This chart shows the direction of change in morale for the selected group. It reflects any shifting of the most recent morale or trend of change. This graph should be viewed in comparison with the Recent Morale Scale graph. If the Recent Morale is high (85+), then it is likely that the Morale Change graph will lean more towards the “steady” range – as there is less room to improve on morale.
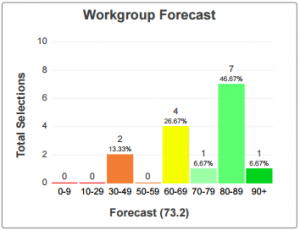
Workgroup Forecast:
The Workgroup Forecast chart depicts how the selected group sees the future of their workgroup. This can be compared to the Recent Morale Scale to determine if the group is optimistic or pessimistic for the future. If this score is higher than the Recent Morale Scale, then the group is feeling like things are going to be getting better. On the other hand, if this score is lower than the Recent Morale Score, then the team expects things to be getting worse in the future. If this is the case, this could be an area to probe to learn more about the team’s situation.
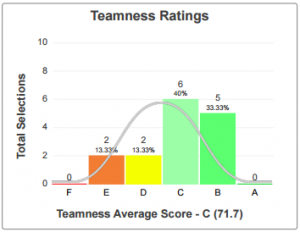
Teamness Rating:
The Teamness Rating chart measures how well the selected group is performing using the typical letter grade scale (A, B, C, D, E / F), where A is a highly cohesive team and F is a team with low or non-existent cohesion. The Teamness Score mimics the Organization Utility Index (OUI) which measures the corporation/team “horsepower” or how much of the resources are creating outputs/performance.
F/E = -100 to 0
D = 0 to +50
C = +50 to +100
B = +100 to +150
A = +150 to +250
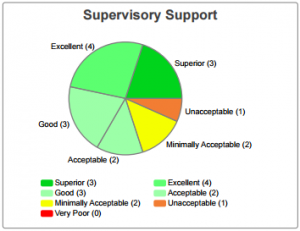
Supervisory Support:
The Supervisory Support chart determines how much the selected group believes they are being supported by their supervisor. This is a subtle indicator of servant leadership and determines the perceived capability of the supervisor to serve the employees. This is shown through asking helpful questions, quick responses, providing needed resources, offering clear assignments, providing feedback on performance, etc.
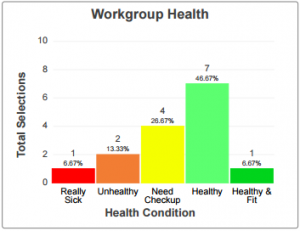
Workgroup Health:
This chart shows the current state or health of the workgroup according to the selected group. When the number of individuals in the “really sick,” “unhealthy,” and “need checkup” range is cumulatively greater than 70%, further diagnostics are recommended. Contact Bartell & Bartell to discuss.
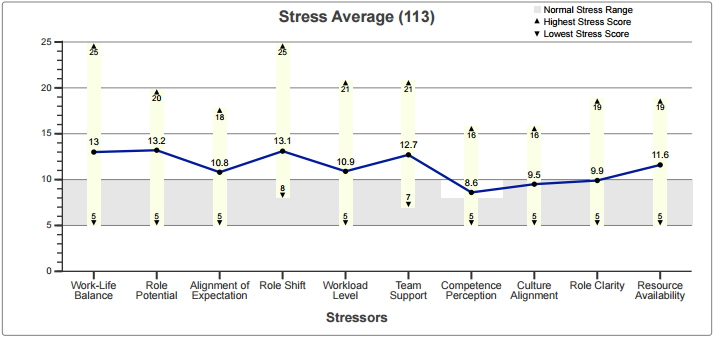
Stress Average:
The Stress Average chart shows the average stress of the selected group by individual stressor, as well as the average overall stress. The individual stress scores range from 5 to 25, and the overall average score can range from 50 to 250. An individual stressor of 10 or higher begins to be an issue. The exception is Competence Perception, which begins to become an issue at 8. Also seen on this report is the range of scores found in the selected data. The top (up) arrow and number designate the highest score for each dimension, and the bottom (down) arrow designate the lowest score seen. This range is helpful to understand the spread of the data.
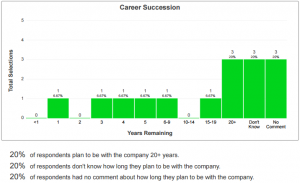
Career Succession:
This scale is a pictorial representation of when employees believe they will quit or retire from your workplace. This helps to plan for the future replacement of workers. It is also useful for customizing any development efforts to the specific team. For instance, if the team is largely expecting to remain in the organization for a long period of time (i.e. over 10 years), there may be a significant benefit from developing a career plan with a longer focus for that team.
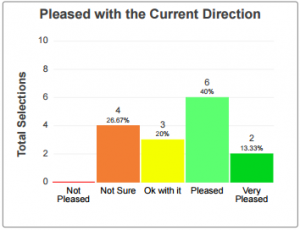
Organizational Outlook:
The final four charts in the Organizational Impact Summary provide an outlook for the company’s progress and direction, based on the views of the team. The four charts included display:
How pleased the group is with the current direction of the company.
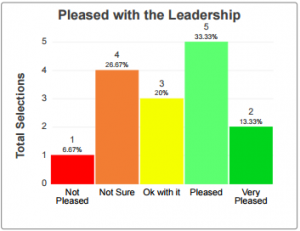
How pleased the group is with the leadership of the company.
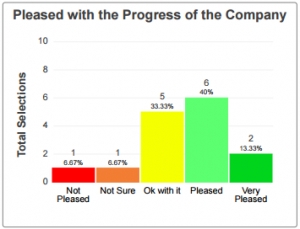
How pleased the group is with the progress of the company.
The Quik Help Summary for the team – or where the team’s stress is originating on seven core areas.
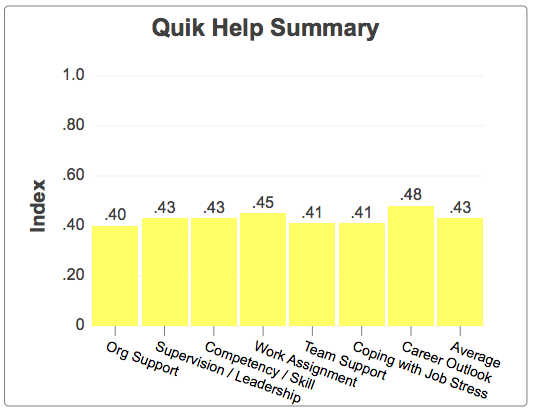
Combined these charts help to paint a picture of how the leadership is perceived and if the organization as a whole (or the selected group) believes progress is being made. Additionally, with the Quik Help Summary, it helps the leadership to decide where to focus energy in developing the team.
How to use the Organizational Impact Summary:
The Organizational Impact Summary shows you how the selected group is being impacted by the organization in the above areas. We recommend using this report for team building initiatives or to give to a manager/supervisor as a snapshot of what’s happening with their team.
Report Interdependencies
Many of the charts on the Organizational Impact Summary work together. For instance, the Recent Morale Change is dependent on the Recent Morale Scale. If the Recent Morale Scale is showing a healthy morale, then a score of “Steady” on on the Recent Morale Changes would be adequate. However, if the Recent Morale Scale is low, it is best to have the Recent Morale Change indicate that morale is improving.
As mentioned earlier, a direct comparison between the Workgroup Forecast and the Recent Morale Scale may also be made. If the Workgroup Forecast score is higher than the Morale Score, the selected group has a positive outlook for the future of their workgroup. If the average Forecast is lower than than the Morale score, the selected group has a negative outlook for the future.
Teamness Rating Interpretation:
The Teamness Rating is an important metric to examine when reviewing a team. In particular, the Teamness Rating scale contains three critical points, each with very different development approaches.
The first is point is at 0 or below, which is where team degeneration becomes exponential. This starts the Organizational Triage (OTR) zone. A score of -37 generally is where a company goes bankrupt or the department is “bleeding out” money.
The second point is “+31” which is the workgroup’s tipping point. At 30 or below, it is the course of least resistance to degenerate. At 32 or above, it is natural for the workgroup to desire to develop. A workgroup should consistently stay over 32 points.
The final point is 100 points, or more precisely, when a workgroup approaches 100 at 93 to 95 points. At 100 points, the workgroup enters the “high performance” zone that requires significant changes or shifts in organization architecture, focal length, leadership, information handling, and performance monitoring. It is not unlike desiring to drive at a sustained speed of 150 to 170 mph. It requires a different type of vehicle than we normally drive: different tires, specialized driving skills, requires us to look further out as we drive, etc.
Career Succession
The Career Succession Scale should be used for two main reasons. First, as the name implies, for planning career succession. The number of years needed to plan for the future replacement of workers is dependent on the career being looked at. For example, if it is a group of professionals, it takes typically five years to prepare someone well enough to handle the duties of a seasoned employee. Other jobs may take more or less but should be calculated using this chart. Second, this scale is also helpful in customizing any development efforts to the specific team. For instance, if the team is largely expecting to remain in the organization for over a long period of time, there may be a benefit from developing a longer focus career plan for that team. Conversely, if the team is planning on leaving in a short period of time, then development efforts may not help to increase the long term stability of the organization.
How to generate an Organizational Impact Summary
The steps to generate the Organizational Impact Summary are the same as the other reports in AMP.
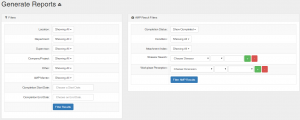
To generate:
- Go to the Generate Reports page.
- Filter the data as you desire using the filters at the top of the page.
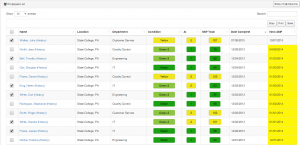
- Select all individuals or choose specific individuals to run the report on by clicking the check boxes.
- Select the desired report – in this case click the button next to “Organizational Impact Summary.”
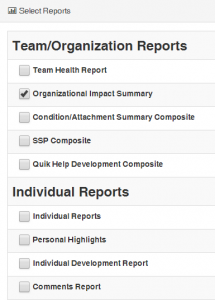
- Click the “Generate Reports” button.
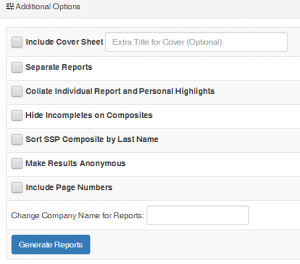
Your report will appear at the top of the page for you to view and download.