Individual Report
Overview:
The Individual Report shows the AMP results for a specific individual, based on their responses to the AMP Assessment questions. This report is designed for quick analysis and shows everything you need to know on two pages. It includes the employee’s Attachment Index, current Condition, their Workplace Perception Profile, and the Stress Source Profile.
Sections of the Individual Report:
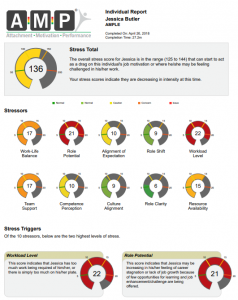
Key Summary:
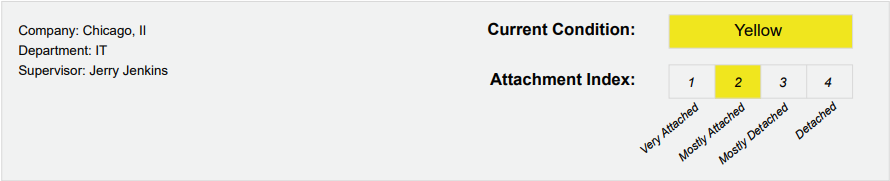
At the top of the individual report, you will see the employees name, their title (if added), the date they completed the AMP assessment, and how many minutes they took to complete.

Next, you will see a list of the filters the individual has been assigned to on the left, and their current Condition and Attachment Index on the right.
Condition can range from Level 1 Green, Level 2 Green, Yellow, Orange, or Red. Green means that they are in the normal range, Yellow is in the caution range, Orange is in the concern range, and Red is an issue. The Attachment Index ranges from 1 to 4, with 4 being the greatest concern. 1 is very attached, 2 is mostly attached, 3 is mostly detached, and 4 is detached.
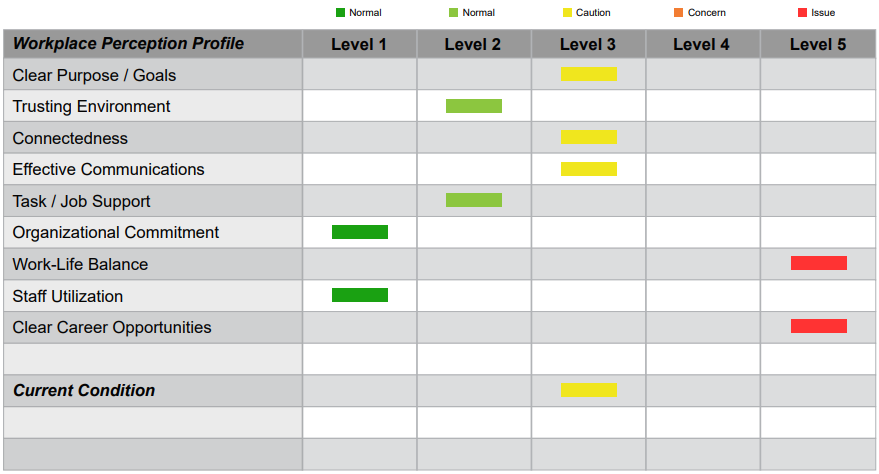
Workplace Perception Profile
Next, we have the Workplace Perception Profile. The Workplace Perception Profile is made up of 12 dimensions – including 11 unique metrics and one summary score (“current condition”). The definitions of the dimensions are found at the end of this document. These dimensions are listed in order of their natural priority.
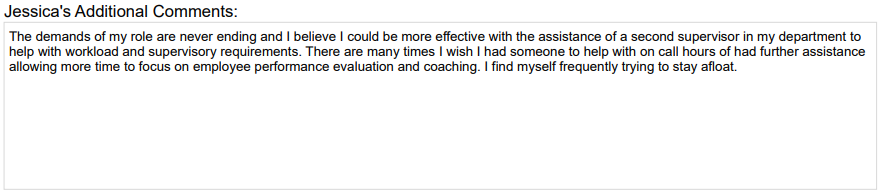
Comments
The employee’s additional comments, if they added any, will be found in the box below the Workplace Perception Profile. Comments can offer valuable insight to how the employee is feeling.
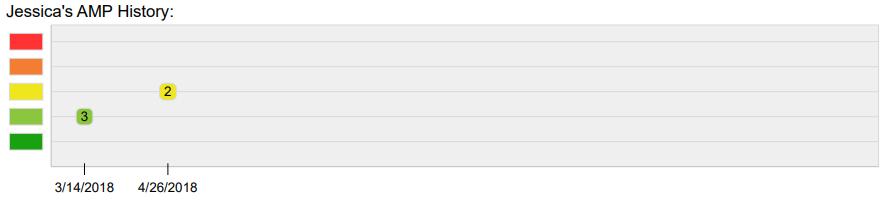
History Graph
Below the comment box is the AMP history graph. The AMP history graph will show up to 10 of the individual’s previous results. The chart starts with the oldest results on the left and moves right. The assessment date is listed beneath the chart, and the color shown is the individual’s Condition at that time. The number within the color is the individual’s Attachment Index.
Validity score
At the bottom of the first page, you will see the individual’s Validity score. This score ranges from 0 (Very Valid) to 4 (Inconclusive; Redo). This measure examines the level of distortion in the assessment, to help you have the appropriate background when you examine the results.
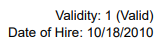
Date of Hire
The Date of Hire will be underneath the Validity score if the date has been entered.
Stress Source Profile
The second page of the individual shows the Stress Source Profile (SSP) for the individual. The first number is Stress Total, which is the sum of the 10 scores below. The total can can range from 50 to 250 points.
The color of the stress “wheel” will change based on the severity of the stress score. Green is normal (50-99), Yellow means caution (100-149), Orange means concern (150-199, and Red means issue (200-250).
Below the total stress is the list of stressors that impact that score. Each individual stressor can range from 5 to 25,
How to use the Individual Report:
The Individual Report provides a detailed view into how an employee is doing, and is helpful in understanding an employee’s situation. The individual report is typically used to work with an individual on the areas within the AMP report that are affecting them. When looking at the Workplace Perception Profile, it helps to start at the top right of the page with any Level 5 dimensions and work your way left, moving to Level 4 and Level 3 dimensions. This shows where the individual is struggling the most.
Similarly, the Stress Source Profile page shows what areas of stress are impacting the individual. If working with an individual, focus on the top 2 stressors listed at the bottom of the page. This are likely to be the triggers of their stress – if these are reduced, the other stressors will also be reduced.
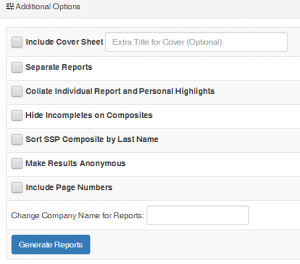
How to generate an Individual Report:
The steps to generate the Individual Report are the same as the other reports in AMP.
To generate from the Generate Reports page:
- Go to the generate reports page.
- Filter the data as you desire using the filters at the top of the page.
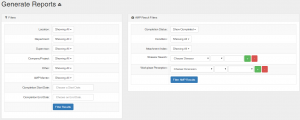
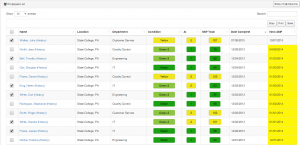
- Select all individuals or choose specific individuals to run the report on by clicking the check boxes next to their names. Clicking the top check box in the heading will select all individuals within your chosen filters.
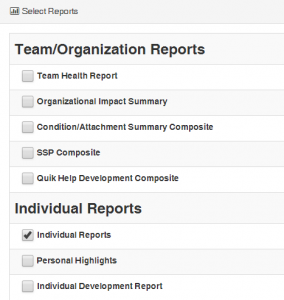
- Select the desired reports – in this case, click the button next to “Individual Report.”
- Click the “Generate Reports” button. Your report will appear at the top of the page for you to view and download.