Comparative Analytics: Group Drill Down
The Group Drill Down page lets you examine groups side-by-side for numerous AMP dimensions. The main difference between the Group Comparison page and the Drill Down page, is that the Drill Down page is focused on AMP dimensions, while the Group Comparison is focused on the group.
To access the Group Drill Down page, first select the “Comparative Analytics” page from the “Reports” drop down on the left. Once on the Comparative Analytics page, you can either:
- Select “Group Drill Down” on the top of the page
- Select a several groups to compare on the Group comparison page and click “Compare Selected”.
Selecting Groups and Data to Compare:
The Drill Down page works very similarly to the Group Comparison page. Simply select the groups you are interested in viewing, apply the filters you desire, and click “Apply All.” If you access the Drill Down page from the Comparison page, your groups will be auto populated. However, if you wish to change groups, you can easily do so by selecting them in the “Show Groups” area.
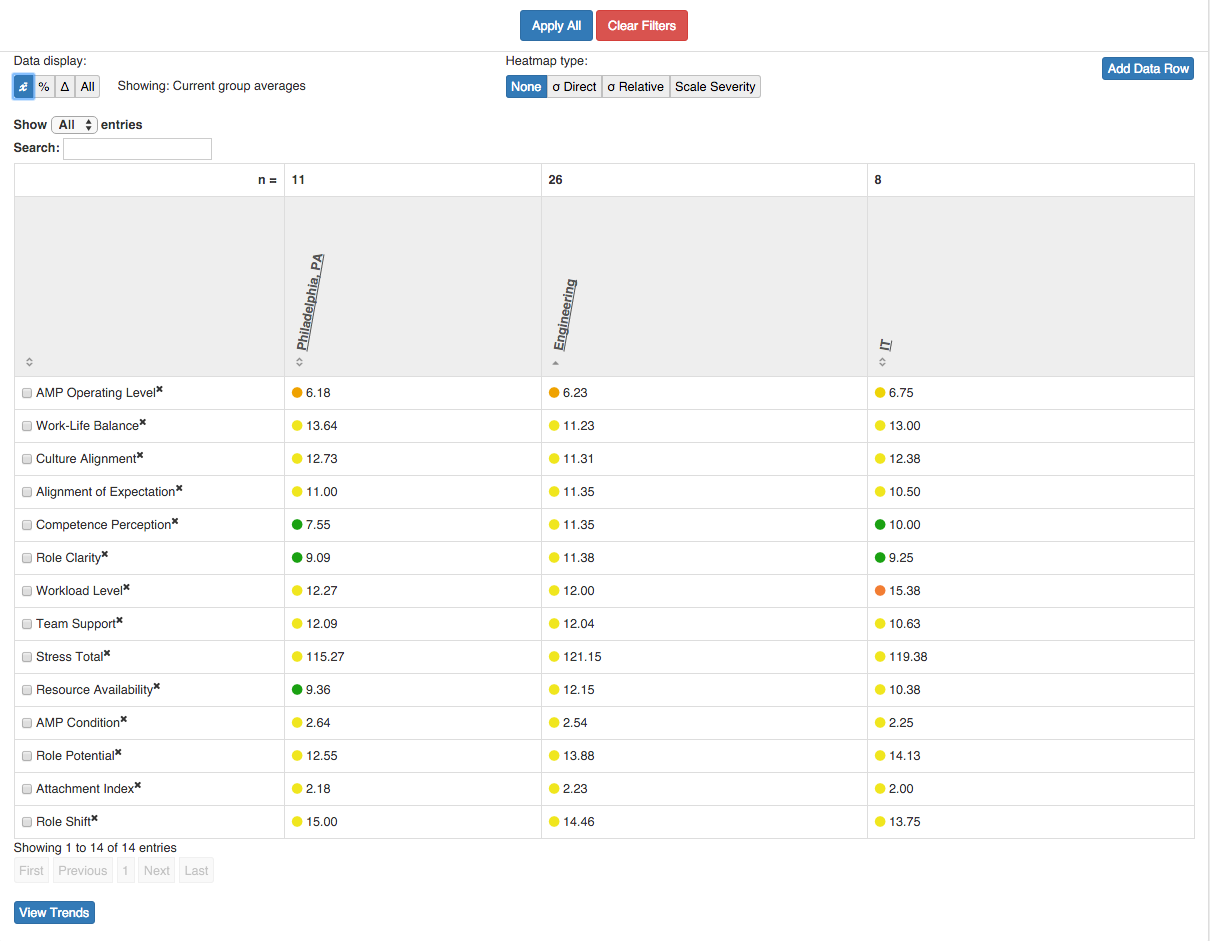
Like the Group Comparison page, you can view data by the Raw average for the group, the percent difference from the baseline, the raw difference from the baseline, or by all three at once.
Adding Data Rows
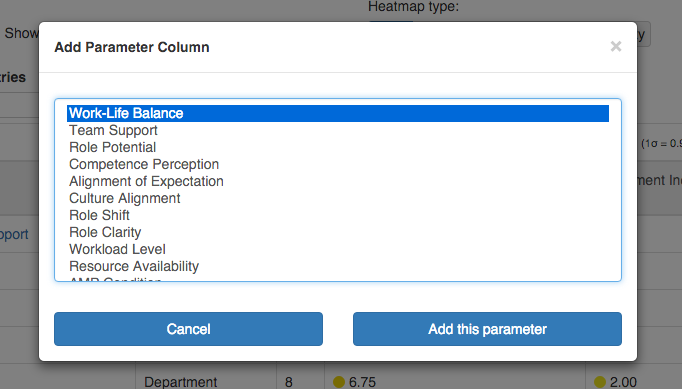
Similar to the Group Comparison page, you can add AMP dimensions (Data rows) to the page to compare the groups across multiple dimensions.
To select new AMP dimensions to compare, select the “Add Data Row” button and select the AMP dimensions you would like to include.
Comparing Data and Using the Drill Down Page:
Often it is valuable to select one group to compare other groups against. This helps you to see if one group is doing better or worse than another group and lets you focus your efforts to where they are most needed. For example, you may want to see how your Finance department compares to your Human Resources department (to determine which has higher moral, greater teamness, less stress, etc.).
To do this, select the baseline group (HR or Finance) and Click “Apply All.” Now the percentages and raw differences will be in relation to the baseline. This is a much faster way of comparing groups than by generating multiple Reports and viewing them side by side.
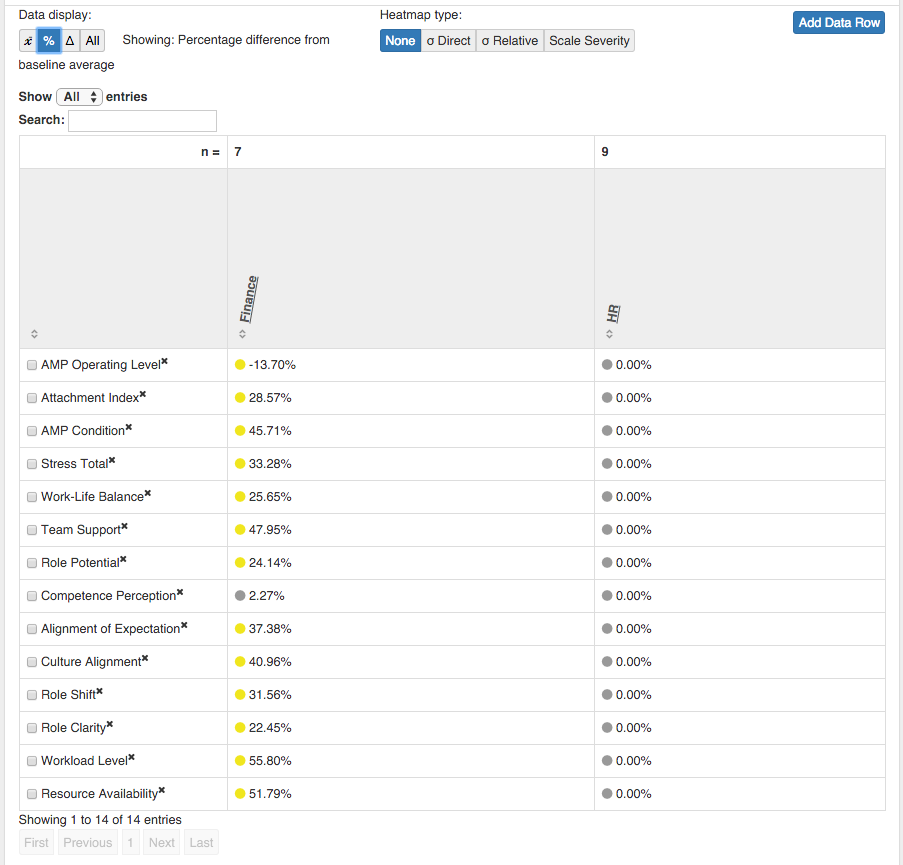
The above image shows a comparison of HR to Finance, where HR is the baseline group. Since HR is the baseline, it shows no percent difference from the baseline for HR scores. Similarly, Finance scores are being compared to the baseline (HR) to allow you to easily see the percent difference between HR and Finance.
Trend Analysis:
The last step in the comparative analytics section is to see how your selected groups and dimensions have trended over time. To do this, you can select the dimensions of interest, and click the “View Trends” button.
This selection will bring you to the Trend Analysis page with the selected dimensions pre-populated.
To learn more about Trend Analysis please see: Trend Analysis